Register
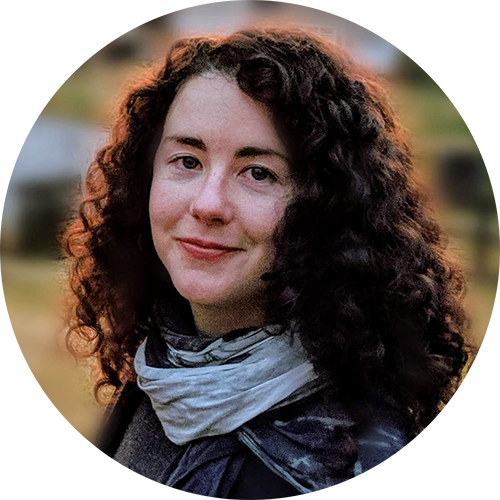
Led by Erin Braswell (Software Developer, Center for Open Science)
 In this skills session, you will learn how to get started with data visualization using Python and Jupyter notebooks. Learn what it takes to get set up and how to use many popular libraries including matplotlib, pandas, and bokeh to build both static and interactive visualizations. We'll dive in to a variety of public datasets, learn how to clean data, and iteratively build visualizations to better understand the data.