This UVA Alum is Transforming Your Spotify Data into Art

Millions of people have used Pete Cybriwsky's website, n-gen, to turn their Spotify data into art. We spoke with Cybriwsky about what inspires his creative process, how the University of Virginia has shaped his life and career, and his new app, Day by Data.
Listen to Pete's podcast with us here.
Q: n-gen allows people to explore unique aspects of their personality through the art form of data visualization, what inspired you to create art prompts like Spotify DNA, Personas, and Timelines?
A: My best work starts from a point of genuine curiosity. I aim to answer people's curiosity about their own habits, interests and identities, revealing the stories that data can tell us about ourselves.
For instance, with Spotify DNA, I wanted people to feel a connection to their music in a new, visual way — almost as if their favorite artists were a part of who they are. When making Spotify Personas, I was wondering how our music tastes might be compared to some of our favorite characters or people from history. When making Timelines, I was curious about how our music tastes have or have not changed over time.
At the end of the day, any good piece needs to tell a story about the person, no matter how big or small, to be effective.
Q: Spotify Wrapped has elevated data visualization to pop culture stardom in recent years. What do you think excites people about being able to see their data represented in creative ways through the likes of Spotify Wrapped and n-gen's individualized art prompts?
A: I think Spotify Wrapped and similar forms of data visualization have enabled people to tell stories about themselves in a way that simply wasn't possible before. People have listened to music for a long time, but now we can finally quantify exactly how much of a fan we are of different musicians or how often we dabble in new genres.
These types of visualizations and art allow people to see themselves in a new light. I think Spotify has done an excellent job of curating this experience for their users with their data, and I think music data lends itself to great stores. That being said, I'm excited to see how these everyday behaviors, from what we listen to how we move, can create new narratives for people. I think all data has a unique story.
Q: Your work allows you to turn data into art for a variety of companies. Why do you think that the value of data visualization is increasing across different industries?
A: I think it's a factor of two things.
- More user data is being collected than ever. Companies collect data all of the time for analytics or to see and make money. Because data is routinely collected about their users, companies can finally execute on compelling visualizations.
- The sentiment around sharing your personal data has changed. Today, people value seeing their personal data presented meaningfully. They're willing to share data in exchange for insights that feel relevant and insightful.
My belief is many companies are already leveraging users' data behind the scenes to personalize the experience, and they have an opportunity to expose this data through innovative and exciting ways to drive a really powerful user experience. Fortunately, I've already had the opportunity to work with a few early stage companies in health and media to do just that.
Q: How has your experience of being a graduate of the University of Virginia shaped your life and career so far?
A: My time at UVA laid a strong technical foundation and encouraged me to think beyond traditional boundaries. I was constantly challenged by the combination of rigorous computer science coursework and an environement that celebrated creative problem-solving.
UVA's interdisciplinary culture gave me the confidence to navigate a range of roles early in my career, from design to engineering and product development. The university fostered a sense of curiosity and resilience in me, shaping the way I approach my work today—especially in using data to build personal connections and stories. Those values continue to guide me as I push forward in the world of data-driven art and visualizations.

Q: What can you tell us about your new app, Day by Data?
A: Day by Data is an iOS app designed to turn the often overlooked details of daily life into beautiful, fun, and insightful visualizations. From step data to screen time, the app transforms your everyday activities into little stories, creating a unique piece of art each time you open it.
The app grew out of a simple question: "How many steps have I walked with my iPhone's over the years?" After discovering I'd taken over 26 million steps since 2017, I realized how much of our lives are already quantified on our phones, and how much potential there is to elevate those metrics.
For better or worse, our phones track countless personal metrics. Day by Data takes these numbers and reveals the stories within them, with a goal to make data feel playful, whimsical, and full of personality. Whether it's uncovering how much time you've spent on your favorite apps or how your daily routines shift over time, the app celebrates these small by meaningful moments in a fun, approachable way.
I'm excited to keep rolling out new features, and I hope it helps people find unexpected insights in their own daily lives.
Q: How has it impacted you knowing that millions of people have used your website to turn their Spotify data into art?
A: Reaching nearly ten million people worldwide has been incredible and has shown me the global appetite for this form of data-based self-expression. It's deeply rewarding to know that n-gen has resonated with people across the globe, using their data to create something uniquely personal and shareable.
In all, the early success has inspired me to keep trying new ideas with different types of data. Every idea is not a hit, but you will never know what resonates with folks until you put it out into the world.
Q: What is your most streamed song of 2024 according to Spotify Wrapped?
A: "CHIHIRO" by Billie Eilish.

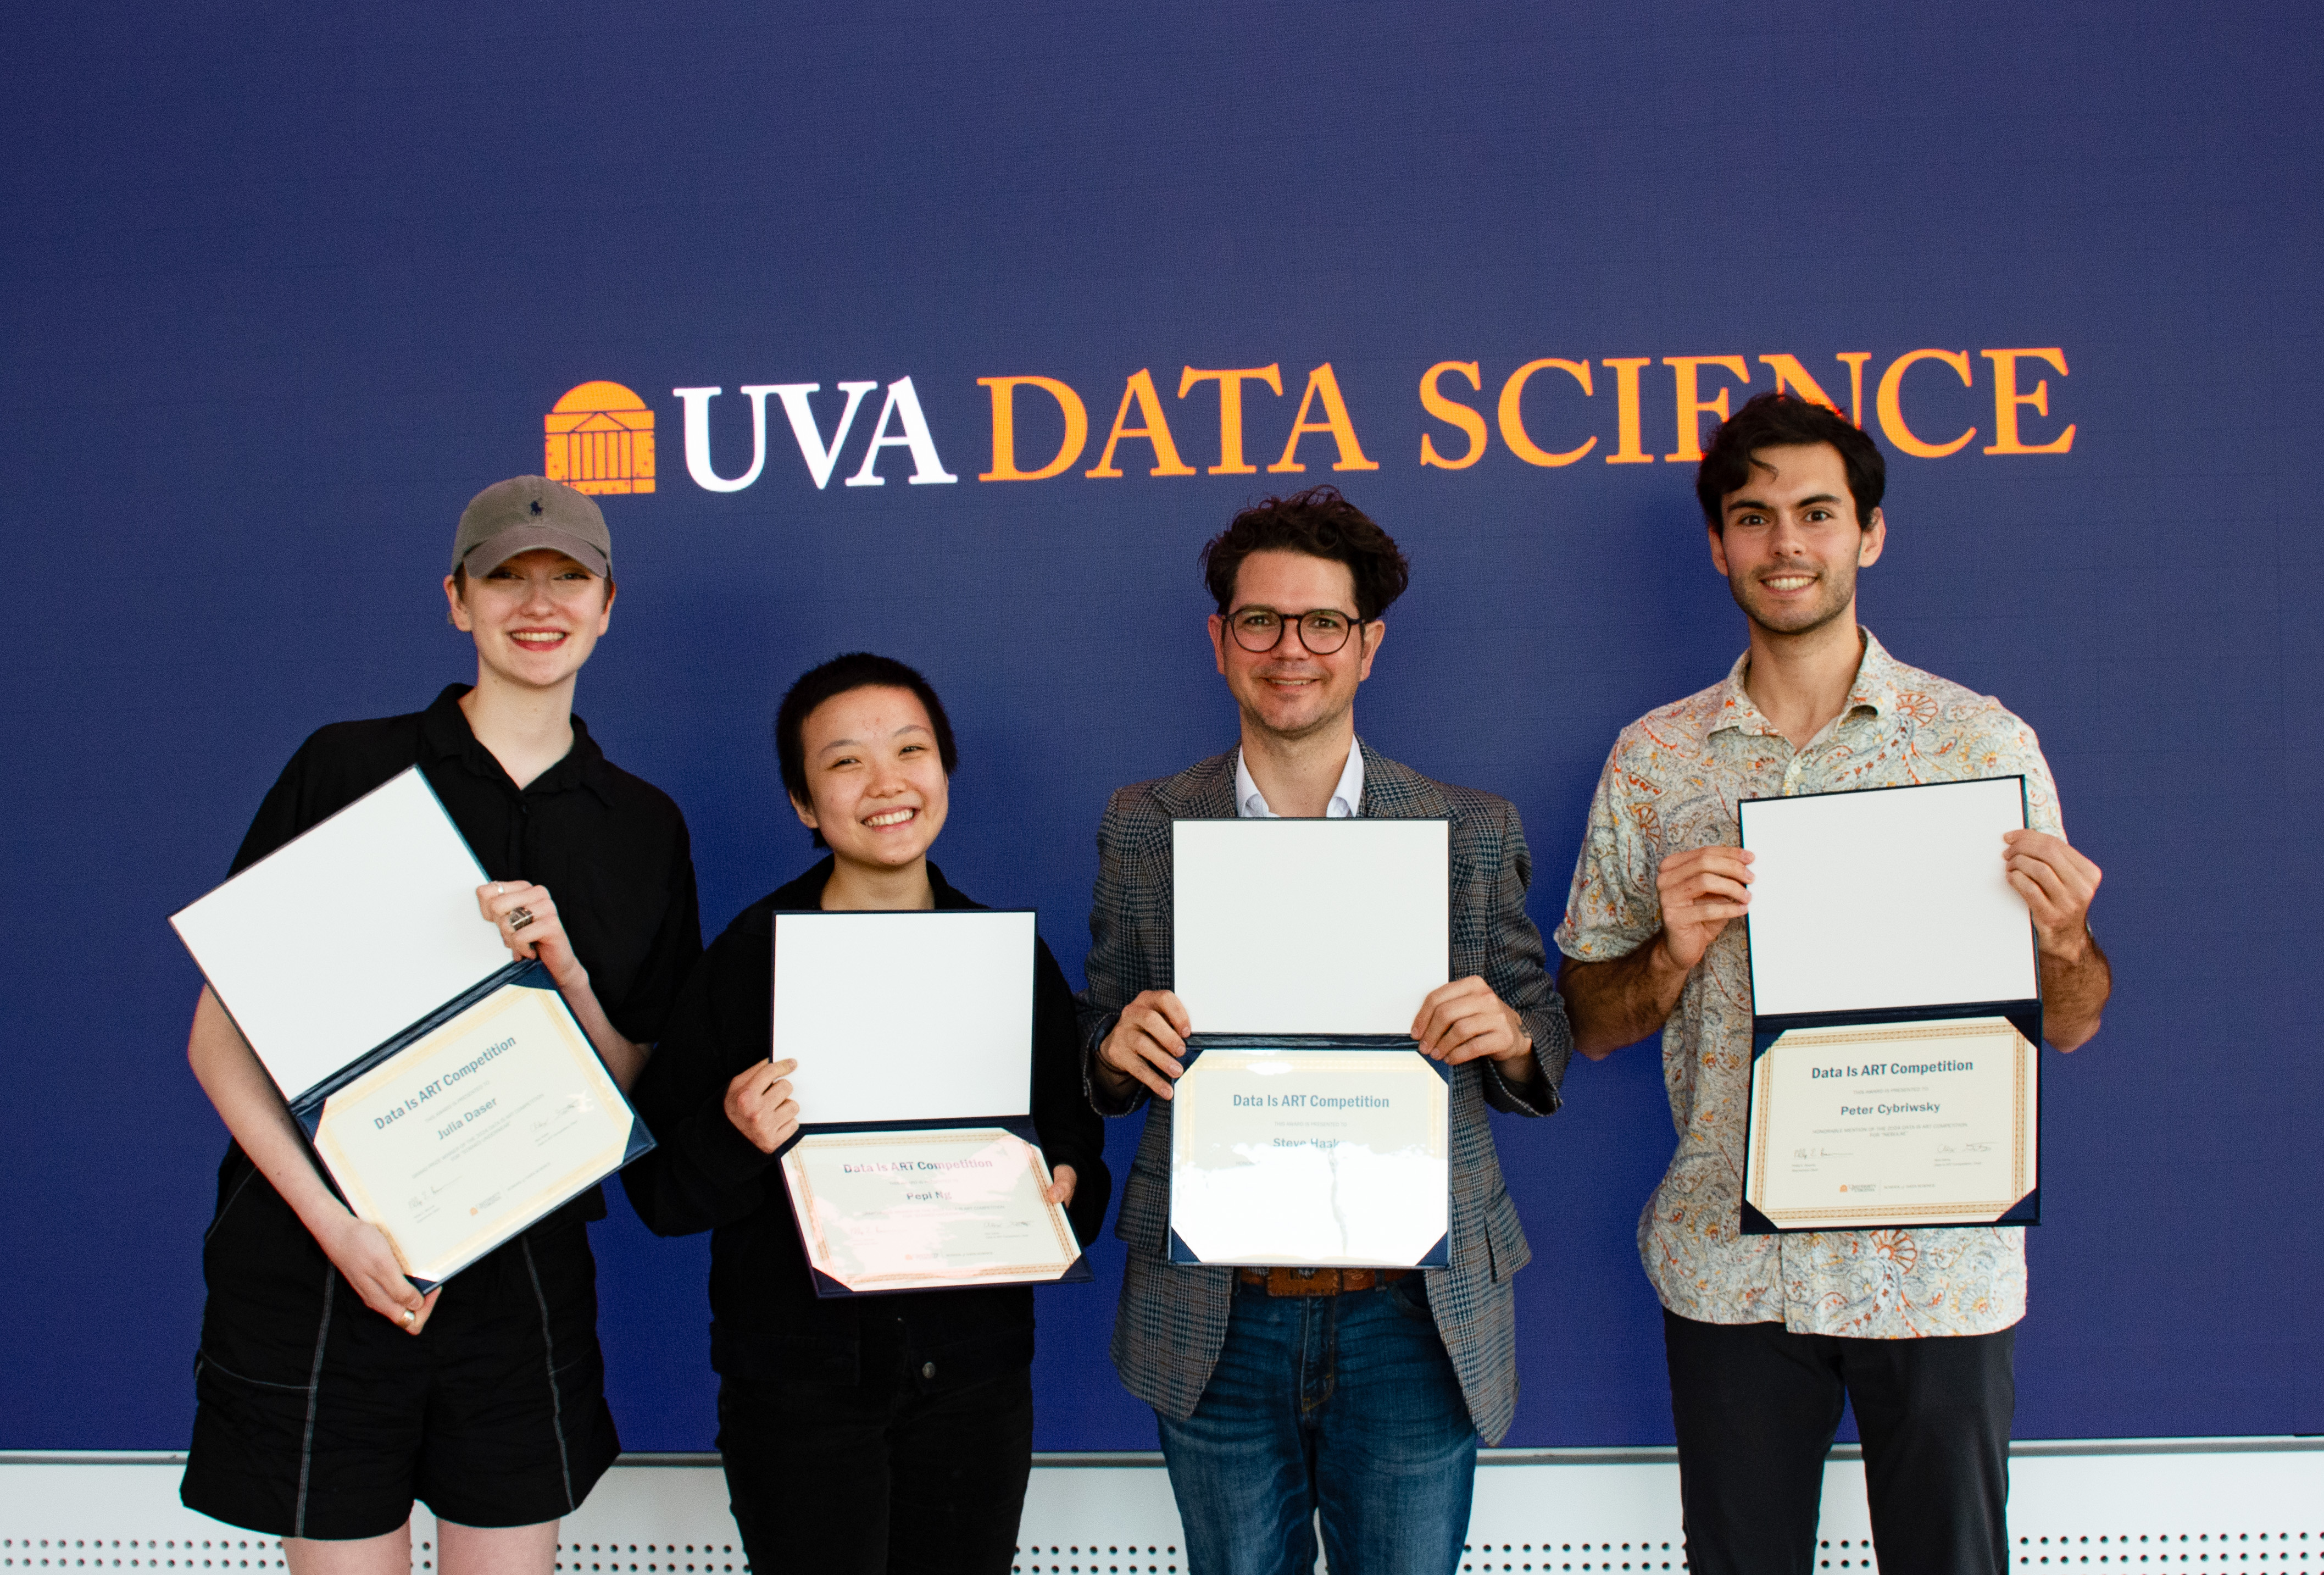
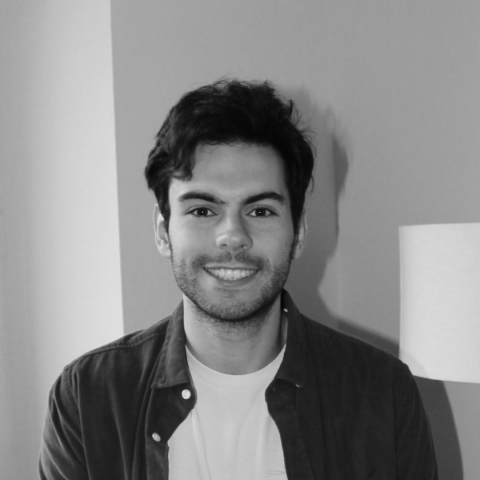
Pete Cybriwsky is an entrepreneur and award-winning artist building at the intersection of data and art. He is currently based out of New York where he is running n-gen, a studio that works with consumer applications to turn their user's personal data into unique, dynamic, digital art. In-addition to n-gen, Pete just launched an iOS App, Day by Data, to turn data into art directly on your iPhone.
Beyond n-gen, Cybriwsky creates generative art and data art influences by the world around him, using technology like The Device to gather data about the environment to reflect in a real-time dynamic art piece.
Outside of this, Cybriwsky is an avid runner, tinkerer, and listener of music. Prior to founding n-gen, Cybriwsky studied engeineering and computer science at the University of Virginia and worked in digital product marketing and design at Prophet.
To stay up-to-date with Pete and his work, you can follow him on Twitter or Instagram and read some of his longer-form thoughts on Substack.
Pete is an alumnus of the University of Virginia where he earned a undergraduate degree in computer science in 2019.


