Image
Illegal fishing is a global security challenge, with significant ramifications for the health of marine ecosystems.
The practice can take a variety of forms and most commonly is seen when fishermen violate local fisheries laws, falsify reports to authorities, or fish in protected waters. It is estimated that illegal fishing costs between $10 billion to $23 billion annually, and it can lead to nefarious activities such as drug and human trafficking.
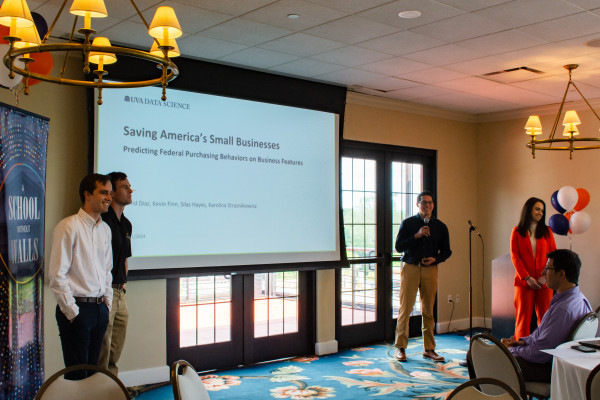
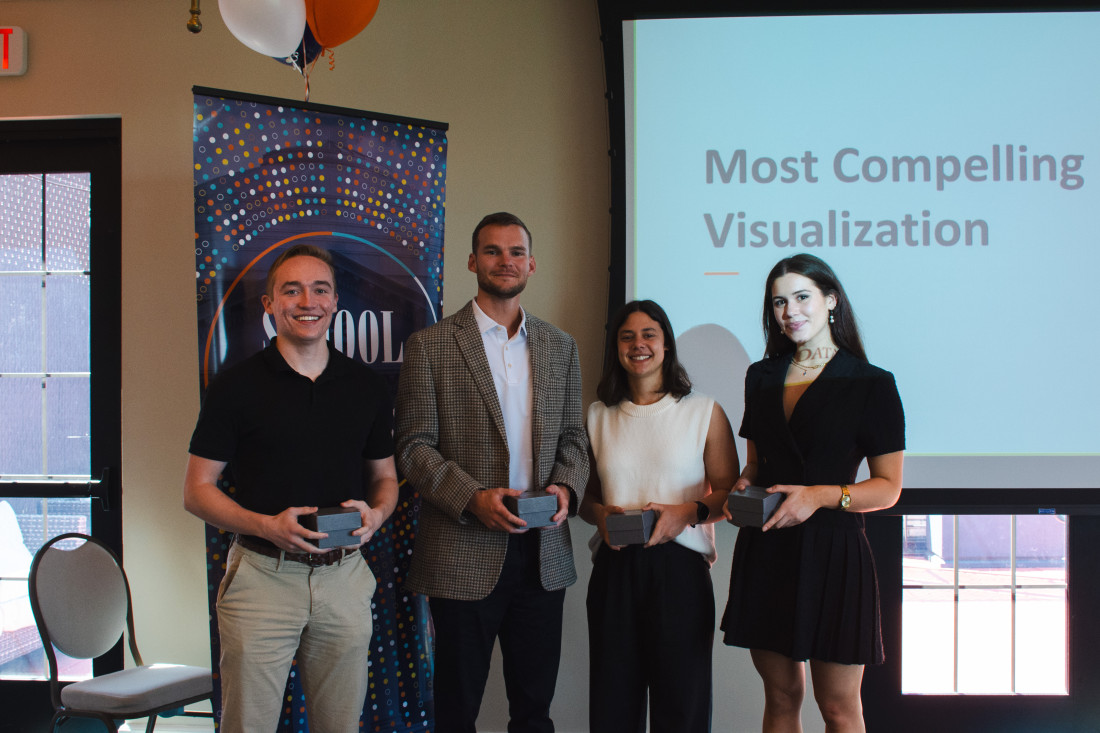
“It’s a huge issue,” said Stephen Kullman, a recent graduate of the University of Virginia’s residential data science master’s program. He and three of his classmates — Samuel Brown, Danielle Katz, and Dana Korotovskikh — presented a data analysis of the topic, which was the basis of their capstone project, shortly before their graduation.
In these projects, small groups of master’s students in the School of Data Science work with a faculty mentor and outside sponsor to analyze a real-world challenge, then share their findings at an event with School faculty, staff, and students toward the end of their final semester.
The illegal fishing team worked with Heman Shakeri, an assistant professor of data science, as well as Tara Valladares and Rebecca DeSipio of GA-CCRi.
The group’s goal: examine how automatic identification system data can be used to help in detecting illegal fishing.
Automatic identification systems, which are standard tracking systems attached to all vessels, include sensors that can be easily acquired online by bad actors and used to track finishing holes in the ocean.
“These actors can cross borders and multiple jurisdictions, each with their own patchwork of laws,” Kullman said.
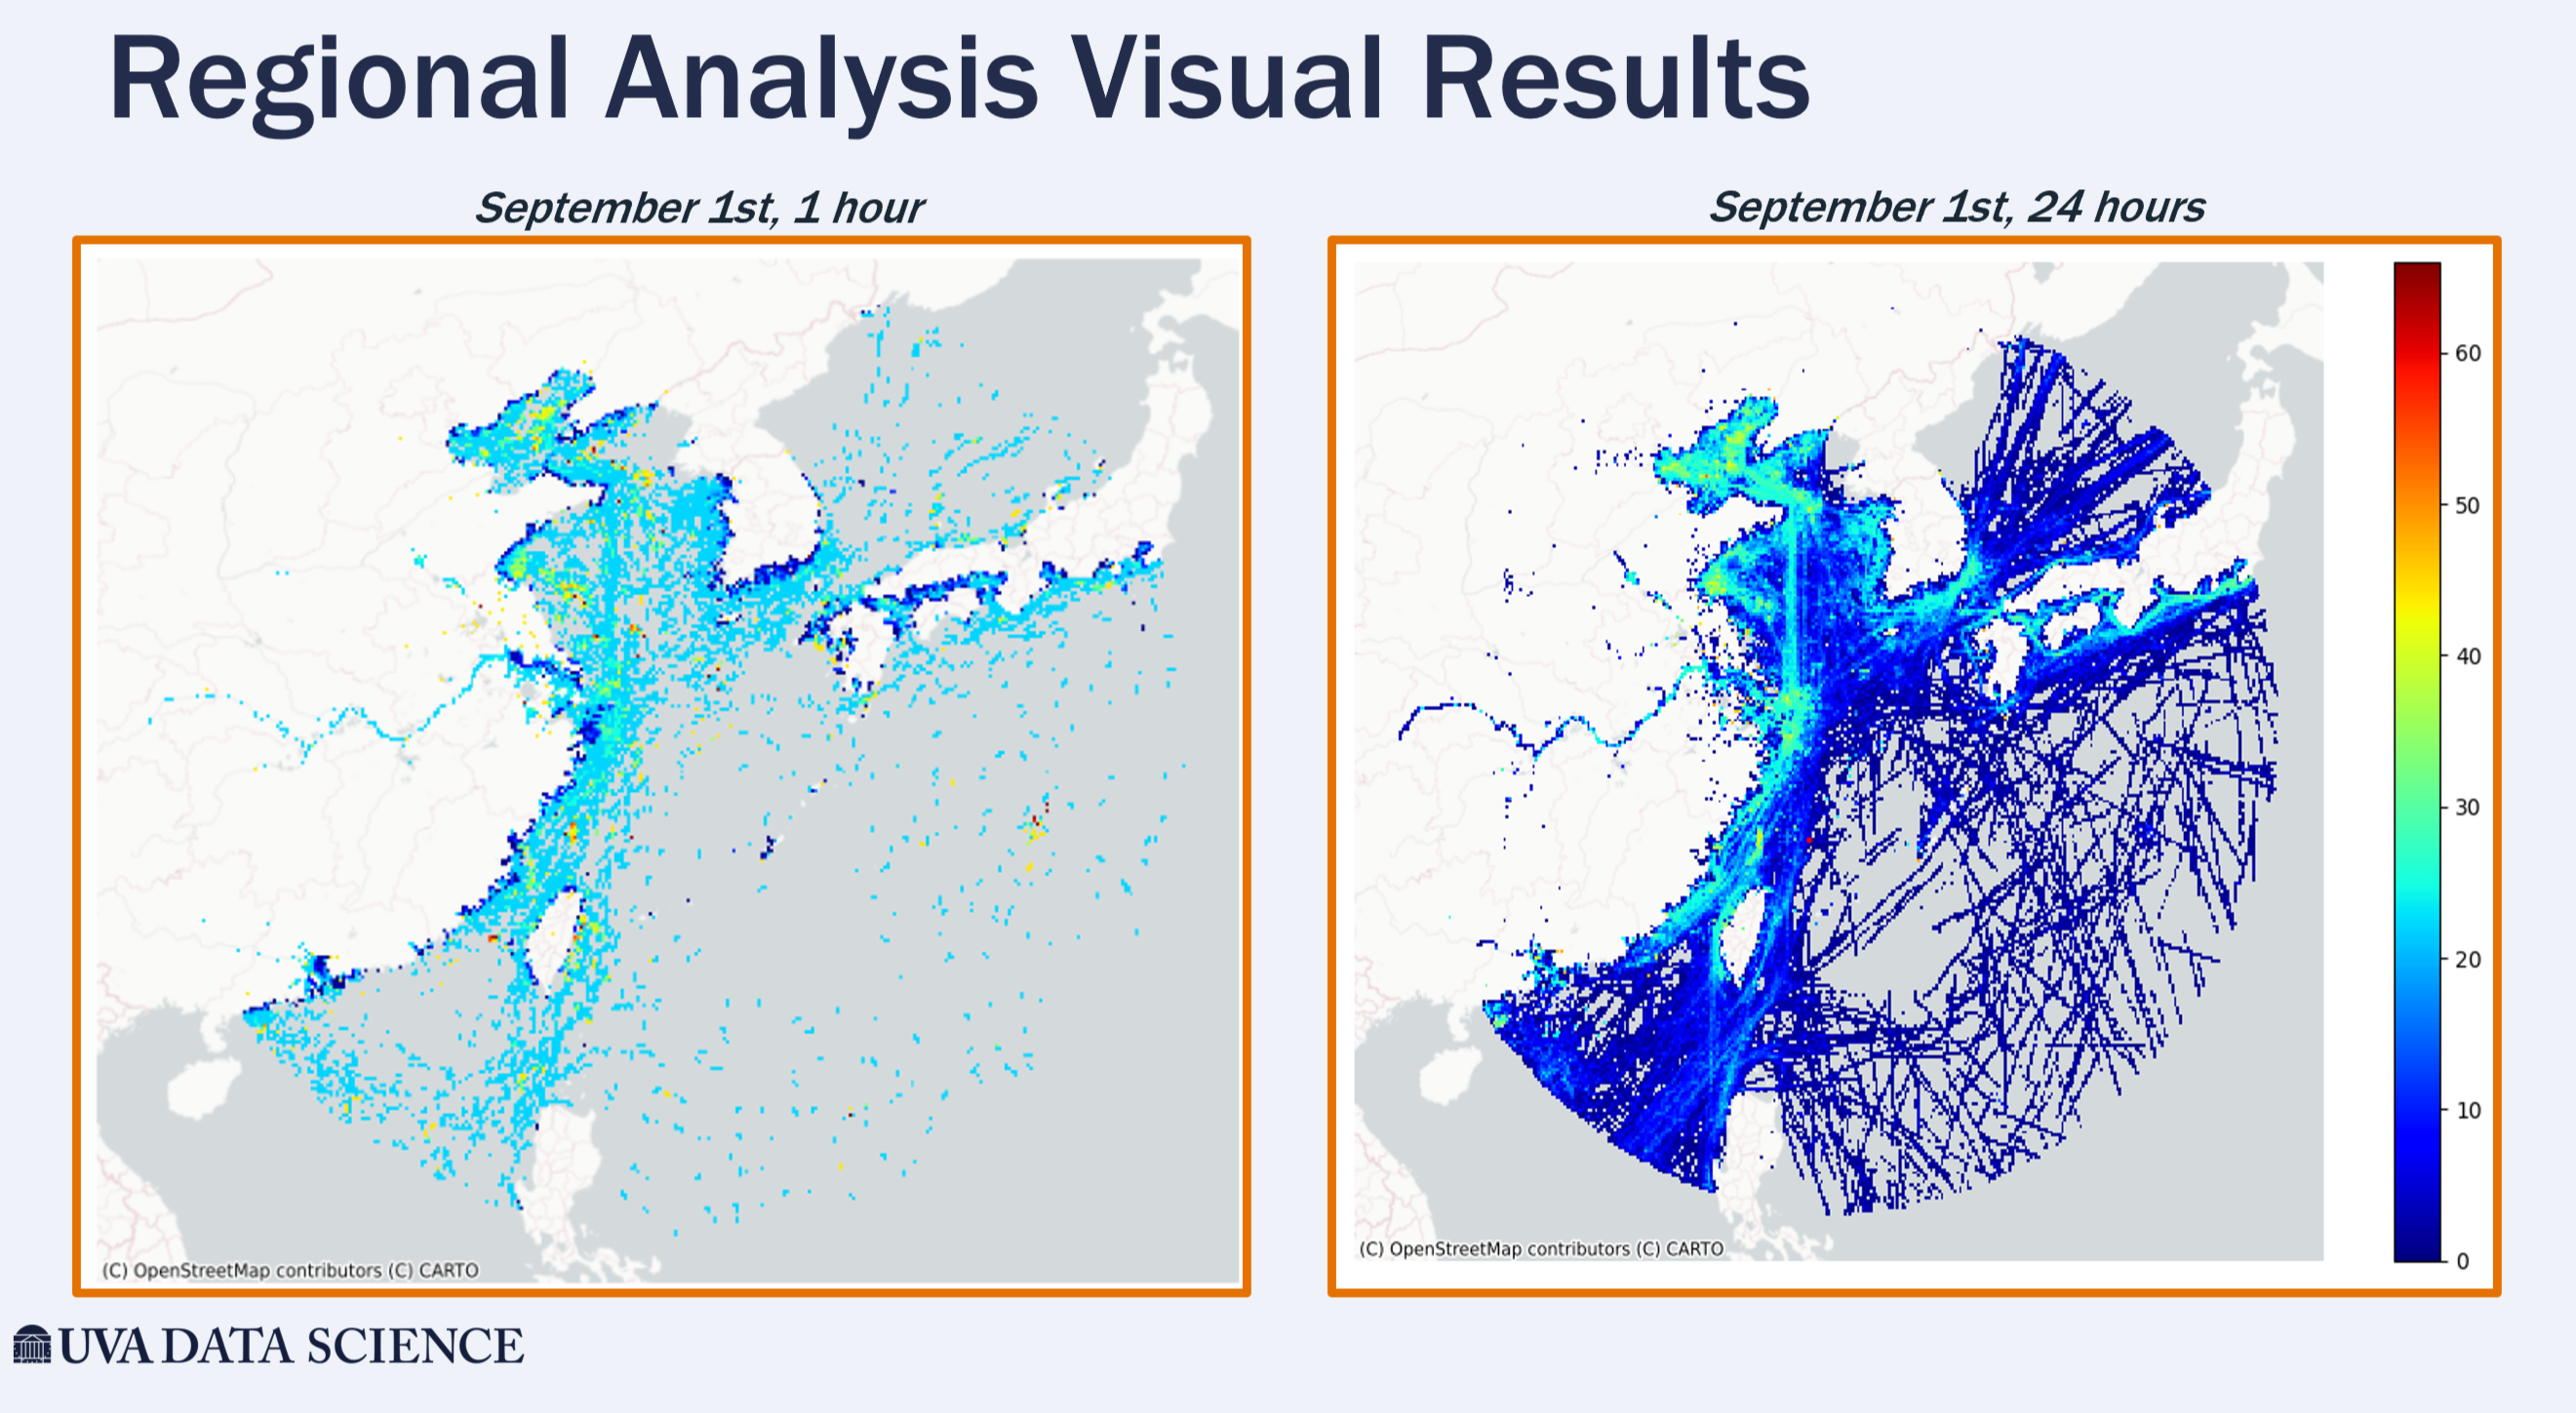
The group focused their study on fishing activity near Southeast Asia and restricted their analysis to a four-day period in 2023 due to the vast amount of data that is generated over a short amount of time.
To conduct their analysis, the group aggregated data and radio signals by unique device trips, which were defined as unbroken transmissions from automatic identification systems less than four hours.
The team created what they called a red flag counter to tabulate how many illegal indicators a vessel created. For example, if the group found a percent sign, that was generally indicative of a battery percentage attached to a network. Another red flag was if an automatic identification system signal suddenly surfaced in the ocean without any prior indication that a vessel had left the coast.
If a device had two or more red flags, it was labeled illegal, while a device with zero red flags was considered legal. This, however, left some data unlabeled, which the group handled by using a prediction model to reclassify it as legal or illegal when the model leaned strongly in either direction.
Using a variety of machine learning techniques, including an unsupervised clustering approach, the team was able to identify clusters where a majority of illegal fishing instances occurred, calculating “hot scores,” which were the number of unique red flags divided by the total vessel count. This score indicates the level of illegal activity occurring in a given area, which the group was able to display visually to show illegal fishing. At the conclusion of the event, the group’s work was voted by those in attendance as the most compelling data visualization.
Shakeri, the group’s School of Data Science faculty mentor, praised the group’s work and the impact it could have.
“By harnessing the power of data, we equip ourselves with the necessary tools to safeguard our marine ecosystems for future generations,” he said.
Subscribe to receive updates from the School of Data Science.